The Cost of Sales Analysis report will help you see how your inventory groups are trending over 4 inventory periods from the select opening inventory date. This would let you identify any potential problems if you noticed a large spike in the costs in a group. The report will display the inventory group's cost of sales percentage for each of the periods and provide the total cost of sales and the averages as well.
Note: If there are not enough periods to display up to 4 from the selected opening date, it will only populate the available periods.
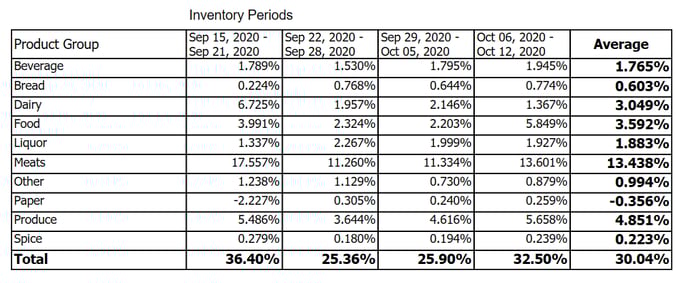
| Header | Details |
| Product Group | The name of the inventory group that is being reported. |
| Inventory Periods/Dates | The usage reporting period that the % is obtained for. |
| Average | The average cost of sales % over the displayed periods. |