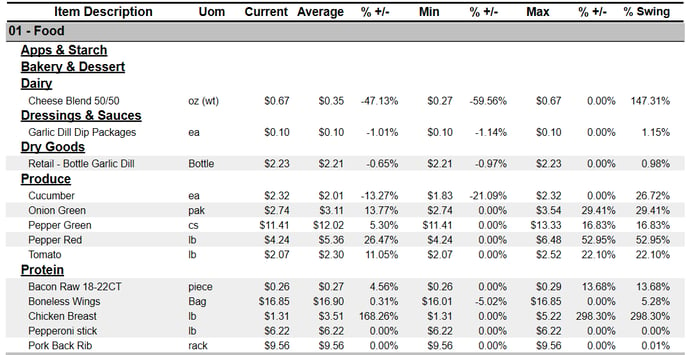
The Price Variance report will show all items within a selected date range that had a price change and showing you the % swing in price. This report will help determine if there are any items that have a huge price change that you would want to investigate and determine if you need to talk to your suppliers about getting a better price.
| Header | Detail |
| Item Description | The item that is being reported on. |
| UOM | The reporting unit of measure for the item. |
| Current | The current cost of the item. |
| Average | The average price of the item. Average = total quantity purchased / total purchases. |
| % +/- | The % =/- is change in price for the respective field (average, minimum, maximum) compared against the average. |
| Min | Lowest price of the item in the selected date range. |
| Max | Highest price of the item in the selected date range. |
| % Swing |