The Buffet Usage Analysis report will show you a breakdown of what items were used for all buffet events in the selected date range. The report will also show the overall cost of the events in the selected date range. It is useful for seeing which items get used the most, and which items are contributing to the largest amount of the cost for the events to help lower future costs.
| Header | Detail |
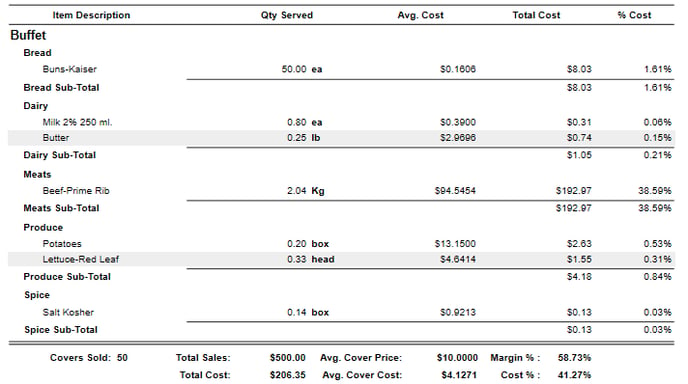
| Item Description | The item / recipe being served. |
| Qty Served | The amount of the item / recipe being served. |
| Avg Cost | The average cost per unit being served. |
| Total Cost | The total cost of the item being served. |
| % Cost | The cost percentage of the item contributed to the event. |
| Summary | Detail |
| Cover | The amount of people served. |
| Total Sales | The total amount of sales recorded for the event. |
| Total Cost | The total cost of the event. |
| Avg Cover Price | The amount charged per cover. Determined by the cover price of the event. |
| Avg Cover Cost |
Average cost per person served. Average Cover cost = Total Sales / Total Cost |
| Margin | The profit margin for the event. |
| Cost % | The total cost of the event. |