The Usage Summary - Group Total report will show you the variances based on the inventory groups. The report will show your largest variances by groups for you to investigate. The report is also popular with accountants as this will show the values for all inventory and purchases.
| Header | Detail |
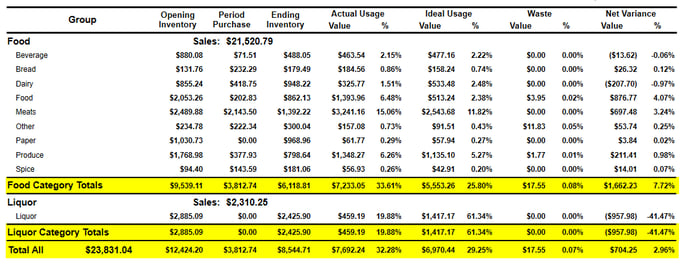
| Group | The group being reported on. |
| Opening Inventory | The opening value from the start date selected for the report. Clicking on the opening amount will generate the Inventory Count Detail report. |
| Period Purchase | The amount that was purchased during the reporting period. Clicking on the period purchase amount will generate the Purchase Summary report for the group. |
| Ending Inventory | The closing value from the ending inventory. selected for the report. Clicking on the closing amount will generate the Inventory Count Detail report. |
| Actual Usage Value |
The value of the amount used during the report period. Amount Used = Opening Inventory + Period Purchases - Closing Inventory |
|
Actual Usage % |
The cost of sales % of the inventory group against its category sales. |
| Ideal Usage Value | The theoretical value of the amount used based on the sales that are entered and the recipes that are linked to those sales. |
| Ideal Usage % | The theoretical cost of sales of the group against its category sales. |
| Waste Value | The value of the amount of waste record. |
| Waste % | The cost of waste against its category sales. |
| Net Variance Value |
The variance for the group. Net Variance = Actual Usage - Ideal Usage - Waste |
| Net Variance % | The cost of sales % of the net variance for the inventory group against its category sales. |