This report will detail all product and sales for a specified date range. It will analyze the products within their sales group and determine whether they have high or low popularity and profitability. This report will determine problem areas on your menu.
The below table will provide the breakdown of how the menu class is determined on the report:
| Menu Class | Detail |
| Star | Profitability and Popularity are high. |
| Workhorse | Profitability is low, but Popularity is high. |
| Challenge | Profitability is high, but Popularity is low. |
| Dog | Profitability and Popularity are low. |
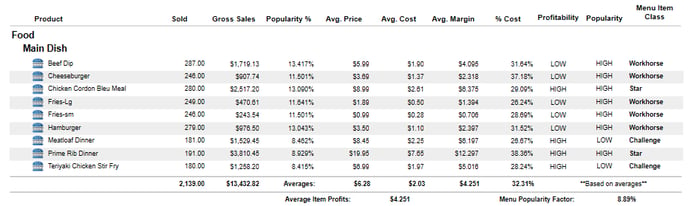
This table will explain what each header on the report represents and how the fields are calculated:
| Header | Detail |
| Product | Product that was sold. |
| Sold | Amount of the product sold. |
| Gross Sales | Total amount of sales brought in from the product. |
|
Popularity % |
Calculated based on the product sold against the total sold for the sales group. Ex. Beef Dip sold 287 out of 2139 = 0.13714, or 13.714% |
| Avg Price | Calculated from the gross sales divided by the quantity sold. |
| Avg Cost | Based on the recipe's costing at the time of the sales entry. |
| Avg Margin | Calculated from Average Price - Average Cost. |
| % Cost | Calculated from Average Cost / Average Price. |
| Profitability |
High or low if the products average margin is over or under the average item profits. Calculations: Average Item Profit = Group Average Price - Group Average Cost Group Average Cost = Total Average Cost / Number of Products in the Group |
| Popularity |
High or low if the popularity % is over or under the Menu Popularity Factor. Calculation: Menu Popularity Factor = 20% of the number of products in the group. Ex. Main Dish has 9 products. The recipe formula is 1/9*0.80 = 0.889 or 8.89%. |
| Menu Class | The menu class is determined based on how popular and profitable the product is within its sales group. Refer to the menu class table to see how the menu class is determined. |