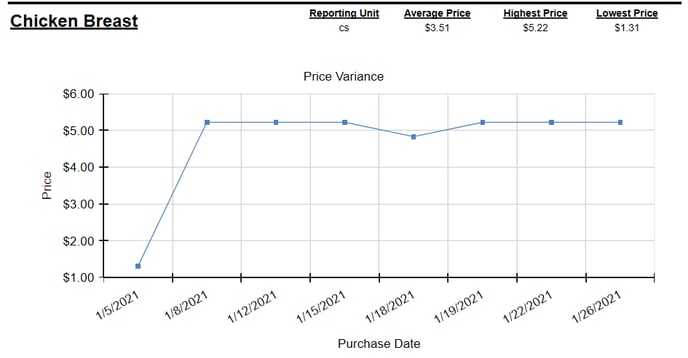
The Price Variance graph will show you the change in price of an item over a selected date range. This report will be useful if you are looking to see how often the item is being purchased, and seeing how often the prices are changing.
The report will display price over a date range. The report will show you the highest price, lowest price, and the average price of the item.