-
OC Pro
- Getting Started
- Setup
- Preferences
- Security
- Utilities
- Nutrition
- Enterprise
- Main Menu Dashboard
- Items
- Count Inventory
- Case Size Overview
- Setting Item Par Levels
- Prep/Batch Recipes
- Setting Prep Par Levels
- Prep / Batch Recipe Scaling
- Menu Product Recipes
- Invoices
- Ordering Stock
- Sales Mix
- Daily Sales Summary – Viewing and Entering
- Item and Recipe Management
- Budget Worksheet
- Reports
- Tracking Waste
- Catering Events
- Buffet Wizard
- Export Accounting Data
- General Information
-
Manuals and Resources
-
Release History
-
Reports
-
OC Enterprise
Sales Mix - Category Summary
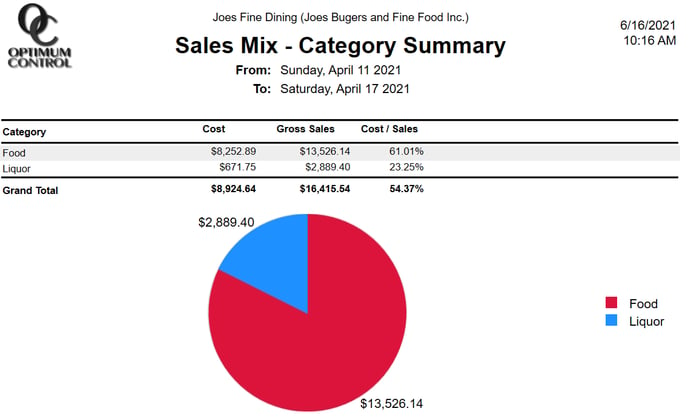
The Sales Mix - By Category report will display your category sales breakdown and the cost of sales for each category along with the total cost of sales. The report will show a pie chart of the sales distribution. This report will be helpful if you need to see a quick break down of your category sales.
Header | Detail |
Category | The categories that have sales in the selected date range. |
Cost | The cost of sales. |
Gross Sales | The amount of recorded sales. |
Cost / Sales |
The % cost of sales. % Cost = Cost / Gross Sales |