Running the Usage Summary Report allows you to view detailed usage information for each of your inventory items. This report can be sorted by by double clicking on each column's header.
Usage Summary Header Numbers
| Number | Details |
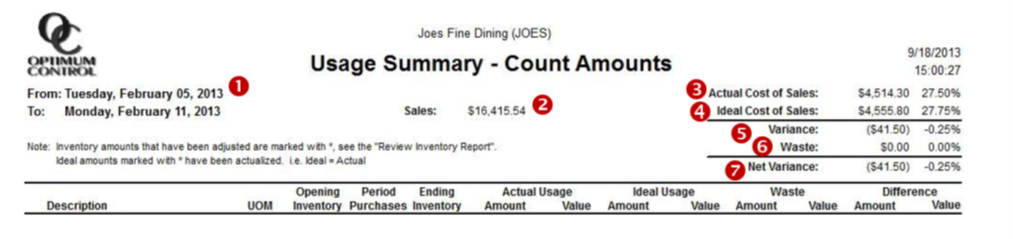
| 1. Date Range | The opening inventory date to the closing inventory date. |
| 2. Sales | The total value of all combined daily sales detail entries for the specified reporting period. |
| 3. Actual Cost of Sales | The cost of sales calculated by opening inventory plus purchases less closing inventory. |
| 4. Ideal Cost of Sales | The cost of sales based on the ingredient usage calculated from the sales mixes brought in from the POS system, event sales, or sales that have been manually entered through till tape. |
|
5. Variance |
The actual cost of sales less the ideal cost of sales before waste is subtracted from the total. |
| 6. Waste | The total cost of the waste that has been entered for the specified reporting period. |
| 7. Net Variance | The variance calculated from the actual cost of sales less the ideal cost and waste. |
| Number | Details |
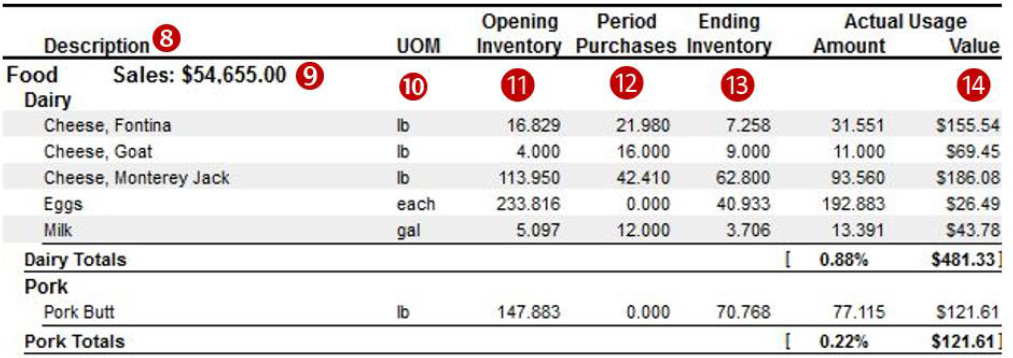
| 8. Description |
The item descriptions are listed in this column and are sorted by alphabetical order. The items are first classified by sales category, and then further categorized by item/product group. TIP: Double-click on an item description to generate an item activity report for that item. |
| 9. Category Sales Totals | The total amount of sales for that sales category that was either imported automatically when sales mixes were processed or manually entered in the Daily Sales Summary. |
| 10. UOM | The unit of measure (UOM) selected as the reporting unit in the items window under "Case Information" |
| 11. Opening Inventory |
The last period's closing inventory. TIP: Double-click on the opening count number to view supporting documentation on the item's inventory valuation. |
| 12. Period Purchases | The total amount of purchases during the specified reporting period. TIP: Double-click on the amount purchased to view the purchase detail report for that item. |
| 13. Ending Inventory |
The summarized inventory counts from the closing inventory. TIP: Double-click on the ending count number to view supporting documentation on the item's inventory valuation. |
| 14. Actual Usage Amount/Value | The total amount used calculated by the opening inventory count combined with the period purchases less the ending inventory count. |
Opening Inventory + Period Purchases - Ending Inventory = Actual Usage Value
Ideal Usage Numbers
| Field | Details |
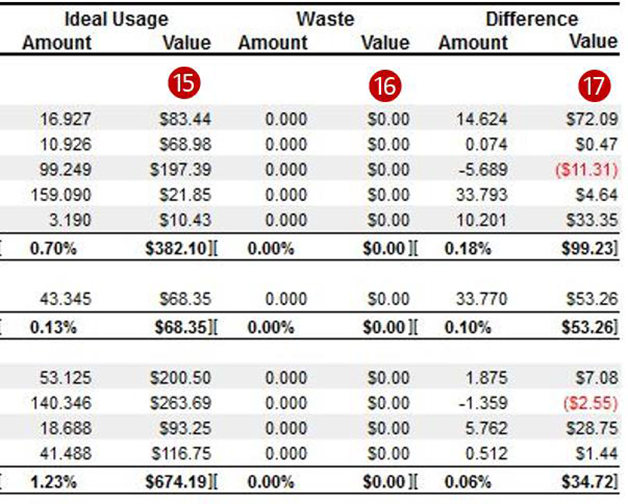
| 15. Ideal Usage Amount / Value |
The total amount of usage calculates by the amount sold for each sales mix based on product recipes. TIP: Double-click on the ideal usage to bring up an Item Sales Detail report showing a listing of what was extracted from inventory for the sales mix and all the related recipes. |
| 16. Waste Amount / Value | The total amount and value of waste calculated using the waste entries. |
| 17. Variance | The total variance for the item calculated by subtracting the ideal usage and waste from the actual usage amount. |
Actual Usage Amount - Ideal Usage - Waste = Difference Value
Usage Summary Reporting Options
| Feature | Details |
| Actualize Usage | If "Actualize Usage" is checked off, the usage summary will be generated with the actual usage for actualized items as well as a compensating ideal usage for those items to cancel out the variance cause by actual usage. |
| Key Items | If "Show Key Items Only" is checked off, the usage summary will be displayed with all the non-key items omitted. |
| Choose Open and Close Dates | A listing of your inventory dates will be presented. |
| Hot List | If you have any hot lists that you would like to filter the report by, choose the list now. Otherwise, leave this blank. |
| Filters – Group and/or Category | To filter the report by a group or category. Filters are also available to use after the report is run. |
Hints and Tips
- Red numbers signify a negative variance, meaning that less inventory was used than what theoretically should have been used during the specified reporting period. Black numbers signify a positive variance meaning that more inventory had been used than what was supposed to have been for the specified reporting period.
- Any preps that were counted on the inventory count sheet will show up in the usage summary, broken down into the items that have been included in the prep recipe and the amount added to each inventoried item is based on the amount of the prep that was counted.
- By checking off the "Key Inventory Item" box from the "Items" window, or the "Key Item" box from the items pick window, you are creating a list of items that will be displayed in the "Key Item Inventory" count sheets.
- When inventory lists are used to generate an inventory count sheet in the reporting period; there will be a dropdown menu at the top of the screen, once the usage summary has been generated, which allows the option to choose which inventory list is displayed in the usage summary.