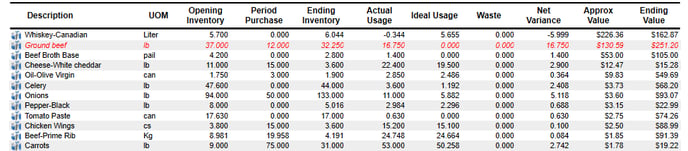
The Usage Summary Top 25 / Bottom 10 report shows your largest overages and under usage for you to investigate. The top 25 / bottom 10 report will show the 25 most over used items and of the most under used items based on the value of the items.
| Header | Detail |
| Description | The item being reported on (item in red indicates the item is now inactive but was active during the period). |
| UOM | The reporting units of measure for the item. |
| Opening Inventory | The opening count from the start date selected for the report. Clicking on the opening amount will generate the Inventory Count Detail report. |
| Period Purchase | The amount that was purchased during the reporting period. Clicking on the period purchase amount will generate the Purchase Detail - By Item report. |
| Ending Inventory | The closing amount from the ending inventory selected for the report. Clicking on the period purchase amount will generate the Inventory Count Detail report. |
| Actual Usage |
The amount used during the report period. Amount Used = Opening Inventory + Period Purchases - Ending Inventory |
| Ideal Usage | The amount used based on the sales that are entered and the recipes that are linked to those sales. Clicking on the ideal amount will generate the Item Sales Detail report. |
| Waste | The amount of waste record. Click on the waste record will generate the Waste Detail report. |
| Net Variance |
The variance for the item. Net Variance = Actual Usage - Ideal Usage - Waste |
| Approx Value | The value of the wasted amount. |
| Ending Value | This is the value of the ending inventory for the item. |